Minimum introduction: Structure of DCore
Data flow
DCore contains a set of programs which perform dynamical mean-field theory (DMFT) calculations for models and materials. The structure of programs and data flow for the DMFT calculation is summarized below.

The DMFT calculation includes two DCore programs: (i) dcore_pre and (ii) dcore as described later.
After the DMFT loop (dcore) is finished, one can compute dynamical physical quantities such as the density of states and the momentum-resolved spectrum functions using the post-processing tool.
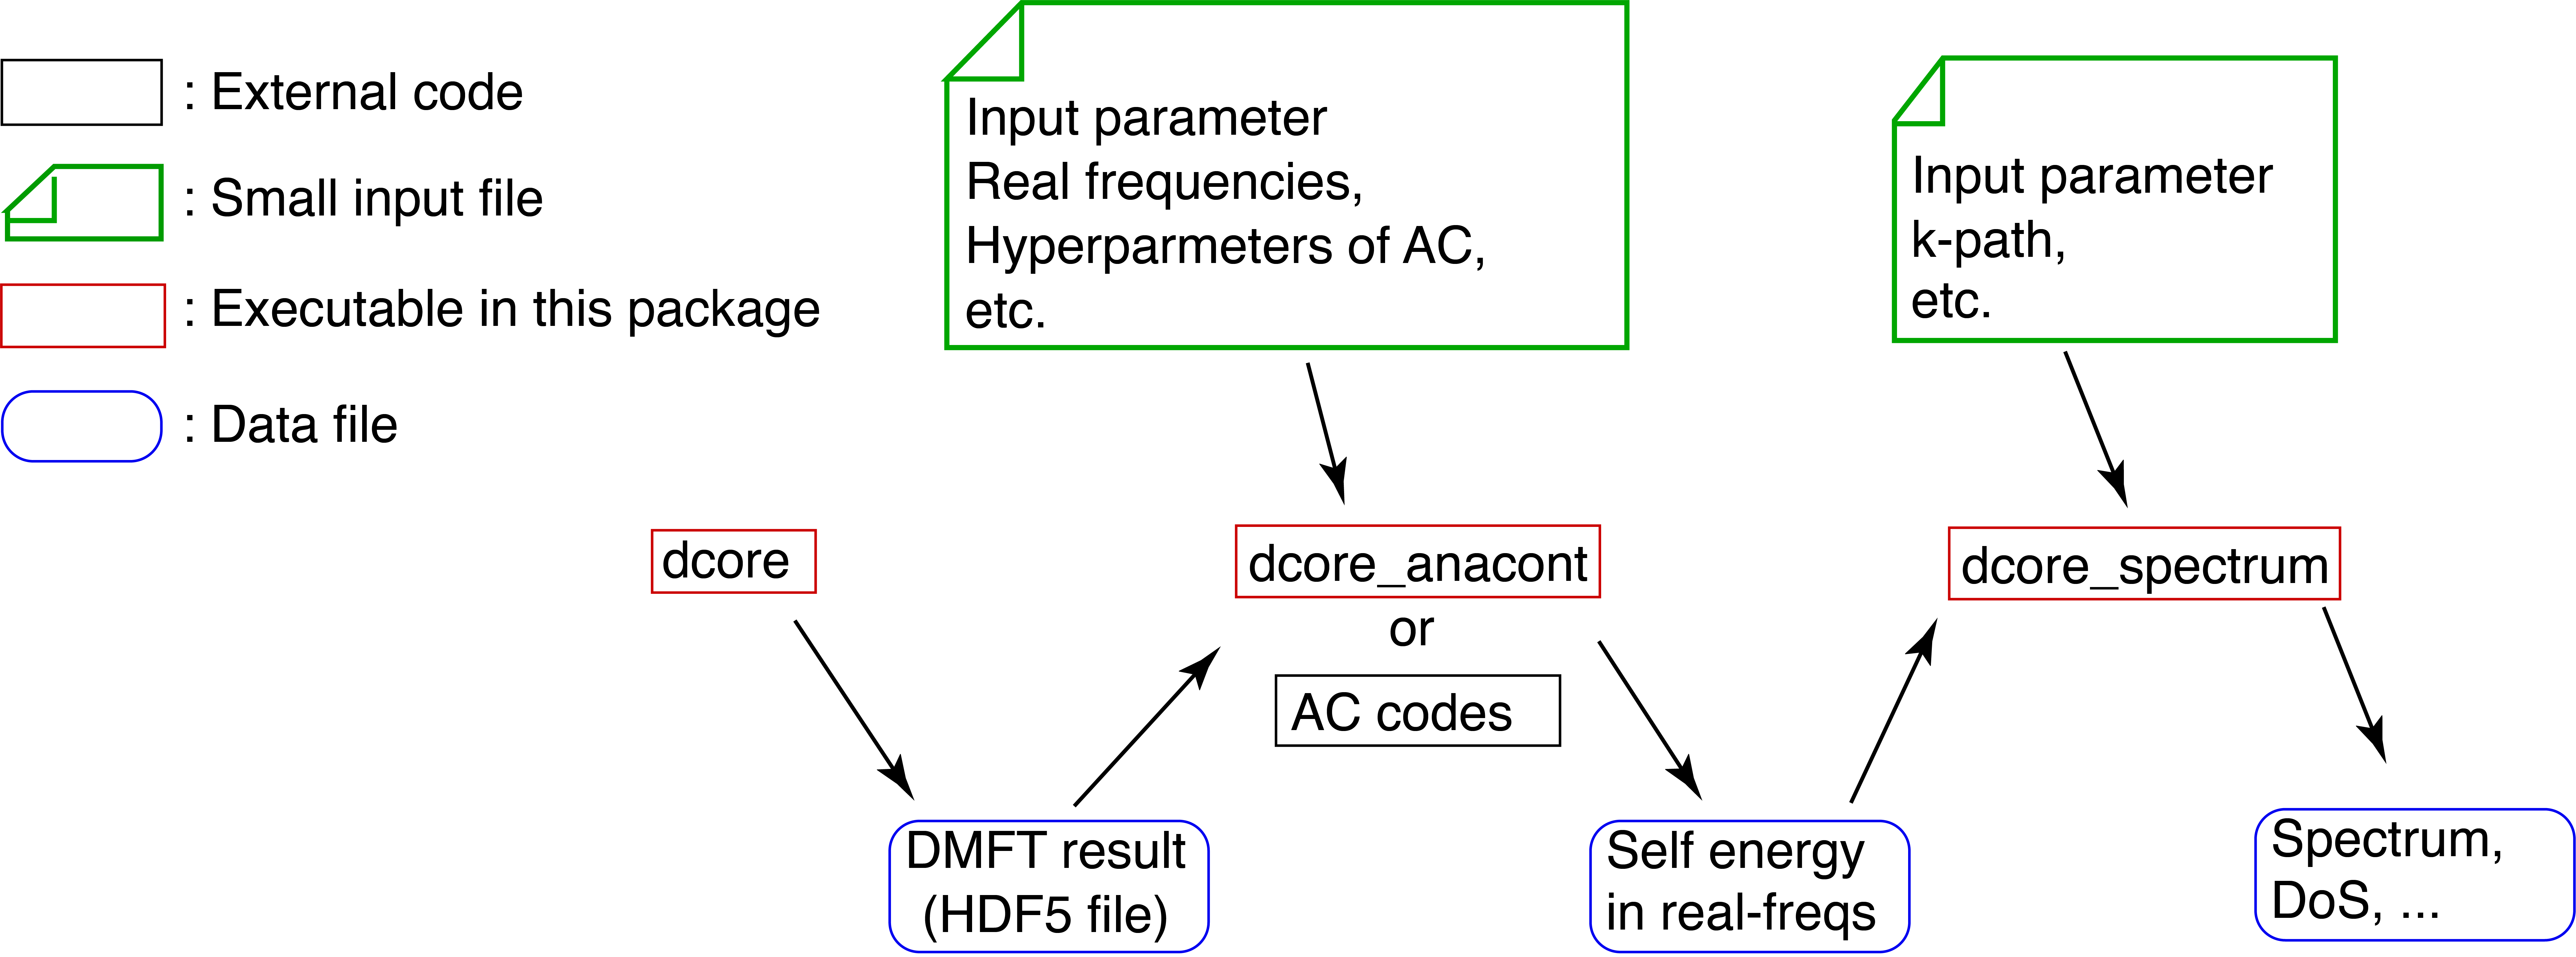
The structure of the post-processing is shown below.

The post-processing tool consists of two DCore programs: (iii) dcore_anacont and (iv) dcore_spectrum.
(i) The interface layer dcore_pre
dcore_pre generates a HDF5 file necessary for the DMFT loop.
Users specify parameters defining a model such as hopping parameters on a certain lattice, and interactions.
The hopping parameters are given either for preset models (e.g., square lattice, Bethe lattice) or using Wannier90 format
(ii) DMFT loop dcore
dcore is the main program for the DMFT calculations.
The effective impurity problem is solved repeatedly to fulfill the self-consistency condition of the DMFT.
For solving the impurity problem, dcore calls an external program such as the continuous-time quantum Monte Carlo method and the Hubbard-I approximation.
(iii) Analytical continuation dcore_anacont
The DMFT loop provides the self-energy in the Matsubara frequency domain.
To obtain physical quantities in the real frequency domain, we need to perform the analytical continuation (AC).
dcore_anacont performs the analytical continuation using the Pade approximation or the SpM method.
Note that users can perform AC by using an external program.
(iv) Spectrum calculation dcore_spectrum
dcore_spectrum computes some physical quantities from the converged solution of the DMFT loop.
Currently, the following quantities can be calculated:
(projected) density of states
Correlated band structures (momentum-resolved single-particle excitation spectrum)