Tutorial
In this tutorial, we explain through a sample calculation of the 8-site Hubbard model on the square lattice.
Run HPhi/vmc.out
For \({\mathcal H}\Phi\)
We calculate the ground state and the correlation function with the following input file
a0w = 2
a0l = 2
a1w = -2
a1l = 2
model="Hubbard"
method="CG"
lattice="square"
t=1.0
U=8.0
nelec = 8
2Sz=0
$ HPhi -s input
For mVMC
First, we optimize the trial wavefunction with the following input
a0w = 2
a0l = 2
a1w = -2
a1l = 2
model="Hubbard"
lattice="square"
t=1.0
U=8.0
nelec = 8
2Sz=0
$ vmc.out -s input
We add the following line to the input file to compute the correlation function.
NVMCCalMode = 1
Compute the correlation function.
$ vmc.out -s input output/zqp_opt.dat
Then the one- and two-body correlation function are written to files
in the output/ directory.
Related files
- StdFace.def (See the manuals for mVMC/\({\mathcal H}\Phi\))
- zqp_opt.dat (See the manual for mVMC)
- greenone.def (Specify the index of correlation function to be computed)
- greentwo.def (Specify the index of correlation function to be computed)
Fourier transformation of correlation functions
Perform the Fourier transformation of the correlation function
by using the utility greenr2k.
$ echo "4 20
G 0 0 0
X 0.5 0 0
M 0.5 0.5 0
G 0 0 0
16 16 1" >> geometry.dat
$ greenr2k namelist.def geometry.dat
Then the Fourier-transformed correlation functions are
written to a file in output/.
Related files
- output/zvo_cisajs_001.dat (Results of correlation function in the site representation)
- output/zvo_cisajs.dat (Results of correlation function in the site representation)
- output/zvo_cisajscktalt_001.dat (Results of correlation function in the site representation)
- output/zvo_cisajscktalt.dat (Results of correlation function in the site representation)
- geometry.dat (Geometry)
- output/zvo_corr.dat (Correlation functions on the k path)
Display correlation functions
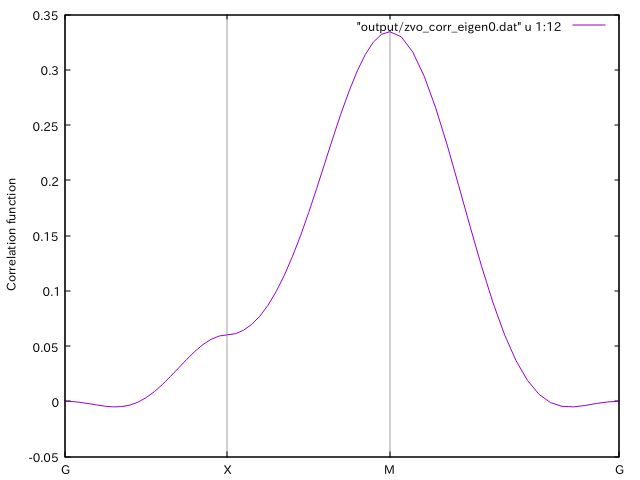
Plot the correlation function in the k space by using gnuplot.
load "kpath.gp"
plot "output/zvo_corr_eigen0.dat" u 1:12 w l

Figure 30: The spin-spin correlation \(\langle{\bf S}_{\bf k}\cdot{\bf S}_{\bf k}\rangle\) (Column 12).
Related files
- kpath.gp (gnuplot script)
- output/zvo_corr.dat (Correlation functions on the k path)
